Getting Started
Zircon is a flexible tool that adapts well to individual use cases. Before you start using it, look through the System Overview and get a sense of what the component classes do and how they are connected together to make a complete data pipeline from source to database to client application.
Zircon’s built-in components will fit many needs out of the box, but with customization can be adapted for nearly any scenario. The default datastore (InfluxDB), messaging protocol (ZeroMQ), and client-side API (Socket.IO) used by Zircon’s components provide excellent speed and robustness.
Make sure to have a picture of what the following components should be for your application:
- Transceivers (interfaces to your sources of data)
- Transformers (tasks - batching, formatting, [de]compression, [de]serialization, etc.)
- Client (end goal - just visualization, or integration into some system?)
The guide below outlines how to install Zircon and use it to store some programatically-generated timeseries data at 2kHz and visualize it in real-time with the web dashboard. From there, it is a simple matter to create a Transceiver for your own data source, run complex queries, and build custom applications.
Installation
Note
Instructions are for Debian-based distributions. Many commands require root privileges.
- Clone the repository.
git clone https://github.com/hmartiro/zircon.git
- Install required Python packages using
pip. I highly recommended usingvirtualenvandvirtualenvwrapperto isolate the Python environment.
cd zircon
pip install -r requirements.txt
- Install and start InfluxDB, the default datastore. It should start automatically from now on.
service influxdb start
- Install
bowerfor managing the frontend JavaScript libraries.
apt-get install nodejs npm
ln -s /usr/bin/nodejs /usr/bin/node # Quirk on ubuntu, node package was already taken
npm -g install bower
- Configure the
PYTHONPATHandDJANGO_SETTINGS_MODULEenvironment variables. If using avirtualenv, do this in youractivateorpostactivatescript. Otherwise, source it from your~/.bashrcor similar.
PYTHONPATH=$PYTHONPATH:/path/to/zircon
DJANGO_SETTINGS_MODULE=zircon.frontend.settings
Note
You should now be able to access Zircon from Python. Make sure import zircon works. Also,
python -m zircon.frontend.manage is the entry point to Zircon’s built-in Django application.
You can interface with it on the command line.
- Initialize the real-time web dashboard
python -m zircon.frontend.manage syncdb
python -m zircon.frontend.manage bower install
That’s it for installation. You are ready to dive into Zircon!
Reporter Process
Copy the file zircon/tests/sample_reporter.py and open it up. This script
initializes and runs a
Reporter. A Reporter is a class that collects data from a
Transceiver, processes it using a chain of
Transformers, and broadcasts the processed data using a
Publisher.
To create a Reporter, we simply initialize it with a Transceiver, a list of
Transformers, and a Publisher. Then, we call run().
reporter = Reporter(
    transceiver=..,
    transformers=[.., .., ..],
    publisher=..
)
reporter.run()
For this demo, we are using a
DummyTransceiver,
which generates a single
signal by sampling a given function. In our case, it invokes sine_wave(t)
at the specified frequency of 1 kHz. We name this signal ‘MY_SIGNAL’. The
output of the Transceiver is a tuple of the form (timestamp, name, value).
transceiver=DummyTransceiver(
    signal_name='MY_SIGNAL',
    data_gen=sine_wave,
    dt=1.0/freq
)
Next, we specify three Transformers. The return value of the transceiver’s
read method is fed into each Transformer’s push method, in a chain.
The first is a
TimedCombiner
, which batches
up the signals for more efficient transmission and database insertion. It reads
in all messages, and outputs them chunked up into a list on a given interval. Every
individual point at 1kHz is saved, but we save each set of 100 points as a group
at a rate of 10 Hz. Batching is not necessary, but it dramatically raises the
ceiling on achievable throughput. By default, the web dashboard downsamples the
data to 10 Hz, so there is no reason to transmit or insert at a faster rate. You
can tweak this based on your needs - if you need 20ms of latency, set the dt
of TimedCombiner to 0.02.
The next Transformers are a
Pickler
and a
Compressor.
The Pickler serializes the
output of the TimedCombiner using Python’s pickle, and the Compressor uses zlib
to shrink the message and save on network bandwidth. If processing power is your
bottleneck rather than network bandwidth, you can skip the Compressor. These classes
are essentially one-liners, but having them as a Transformer interface makes them
awesome to plug and play. You can use any method of serialization, but the output
of the last Transformer must be a bufferable object (a string, usually).
transformers=[
    TimedCombiner(dt=0.1),
    Pickler(),
    Compressor()
],
Finally, the serialized data is broadcast by a Publisher to any processes that want
to listen. Zircon’s default Publisher is the
ZMQPublisher, which writes the data to
any subscribed entities, local or remote, using the ZeroMQ messaging protocol.
Okay, enough talk. Are you ready to run the reporter process? Here it is:
python sample_reporter.py
When you start it, you might see some output from the Publisher of how many messages it is sending. Nothing else is happening, because nobody is listening yet. We need to start another process, an Injector.
Injector Process
Copy the file
zircon/tests/sample_injector.py and take a look at it. Like a Reporter, an Injector
has three components.
First, a Subscriber receives serialized messages from a Publisher. The Subscriber should
specify the network address of the Publisher (localhost is default). The default subscriber
is the
ZMQSubscriber, which connects to the
ZMQPublisher.
Next, a series of Transformers are applied to the data, just like with the Reporter. Here, we simply use a Decompressor to reverse the Compressor, and an Unpickler to reverse the Pickler. The output of the Unpickler is a list of (timestamp, name, value) tuples as outputted by the TimedCombiner.
injector = Injector(
    subscriber=ZMQSubscriber(),
    transformers=[
        Decompressor(),
        Unpickler(),
    ],
    datastore=InfluxDatastore()
)
injector.run()
Finally, our data is fed to a Datastore. Datastores implement methods
to insert and query signal data. Each message outputted by the Unpickler is fed into the
insert method of the Datastore.
Zircon’s built-in Datastore is the
InfluxDatastore,
which uses InfluxDB, an extremely fast timeseries database with powerful
query capabilities. Our client applications interface with the Datatstore.
Now, start the Injector:
python sample_injector.py
Start the Reporter up as well, and the Injector should output that it is saving around 90-95 points every 0.1 seconds, whatever the DummyTransceiver actually outputs at. Your signal is now being saved into an InfluxDB database instance. If you like, you can explore it directly using InfluxDB’s web UI. However, we will be focusing on Zircon’s dashboard.
Real-time Dashboard
With your Reporter and Injector processes running, your sine wave is flowing into the Datastore. We can visualize this signal using Zircon’s web interface. The web interface provides a general purpose solution for viewing signal data, and more importantly acts as an example for how to build custom applications using Zircon.
Start the web interface using Django:
python -m zircon.frontend.manage runserver_socketio 0.0.0.0:8000
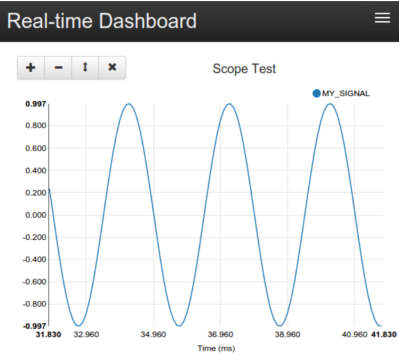
Navigate to http://localhost:8000/. You should see a blank page with a header bar. Click the
‘+’ button in the upper-right corner to add a scope, and name it ‘my_scope’. Now, click the ‘+’
in the scope to add a signal, ‘MY_SIGNAL’.
You should now see your glorious sine wave! It is being dynamically sampled at 100ms by default, from the Datastore. You can play around with the plot controls, mouse-over to see the values, and pause/play the scope from the top bar. Note, the scope configuration is encoded in the URL, so you can copy and paste it to save configurations.
There are two Django apps running here - the datasocket and the dashboard. The datasocket
provides a Socket.IO API directly to the Datastore. The dashboard acts as a client to the
datasocket. The client-side JavaScript in dashboard opens up a connection to the Socket.IO
API and requests data for the signals the user has selected.
You can browse the code at zircon/zircon/frontend.
Onward
Hopefully, you now understand how the Zircon stack works! Here are some things you can try:
- Run your Reporter and Injector processes on different machines. Just specify the IP address
to the ZMQSubscriber, like
ZMQSubscriber(host='192.168.1.45'). - Query the Datastore programatically, just by initializing an instance of
InfluxDatastore. You can take a look atzircon/zircon/utils/export.pyfor an example. You can query for something like the mean of a signal value, for a given hour, in 1 second buckets. - Monitor six signals at once, using
zircon/tests/noisy_imu_reporter.py. - Take a look at some common Transformers in
zircon/zircon/transformers/common.py. - See how high of a throughput you can get, or how low of a latency. You can play around with
the dashboard code at
zircon/zircon/frontend/dashboard/static/dashboard/js/dash.js. In particular, play with thedata_frametimeandview_frametimevariables.
Create a Transceiver that reads from your sensor! Just extend BaseTransceiver and implement
the read() method. Zircon can be useful for anything from Arduino signals to events in
a distributed network.